

Occupancy Rate Management for Vancouver Airbnb Owners

TL;DR:
Maximizing RevPAR requires managing occupancy by adjusting pricing, policies, and calendar availability. Properties at high occupancy with strong rates outperform underpriced ones with even higher occupancy. Nestoriaestates offers data-driven management and automation to optimize revenue for Vancouver short-term rentals.
Occupancy rate management is the set of pricing, calendar, and policy decisions that control how many nights your short-term rental gets booked — and the goal is to maximize RevPAR, not raw fill rate. The formula is simple: (Booked nights ÷ Available nights) × 100. Nights you’ve blocked for personal use or maintenance don’t count as “available,” so keep them out of the denominator or your numbers will lie to you. The one-sentence verdict: a Vancouver property running at a high occupancy with a strong nightly rate will almost always outperform one at an even higher occupancy that got there by underpricing.
Benchmark to know: Well-performing properties typically average between 55% and 78% occupancy depending on market. Consistent 90%+ occupancy is usually a sign the nightly rate is too low, not a sign of success.
Table of Contents
Why does occupancy rate matter for your revenue?
High occupancy feels like winning. It isn’t, necessarily. The metric that actually tells you whether your pricing and calendar are working together is RevPAR — Revenue Per Available Room Night — calculated as ADR × occupancy rate. A property earning $200/night at 60% occupancy generates $120 RevPAR. The same property at $140/night and 90% occupancy generates $126 RevPAR. The difference looks small until you multiply it across a full year.
The ADR vs. occupancy tradeoff shifts with the season:
Peak season: Hold your rate. High demand means you can push ADR 40–100% above baseline without losing meaningful occupancy. Discounting during peak is the single biggest revenue mistake Vancouver owners make.
Shoulder season: Modest rate reductions of 10–25% below peak can maintain occupancy without gutting RevPAR. Adjust minimum stays to prevent orphan gaps.
Off-season: Fill the calendar. An empty night earns nothing and can never be recovered. A rate that books beats an optimistic rate that sits idle.
Pro Tip: If your occupancy has been above 90% for two or more consecutive months, test a 10–15% rate increase before assuming your calendar is healthy. Persistent near-full occupancy almost always means you’re leaving money on the table.
How do you calculate occupancy rate correctly?
Occupancy rate = (Booked nights ÷ Available nights) × 100. That’s the whole formula. The part owners get wrong is the denominator.

Worked example: You had 20 booked nights in a 30-day month, but 4 nights were blocked for a personal stay. Available nights = 26. Occupancy = (20 ÷ 26) × 100 = 76.9%, not 66.7%. That gap matters when you’re benchmarking against local comps, because excluding blocked nights from available nights is the correct method — including them artificially deflates your rate.
Scenario | Booked nights | Available nights | Occupancy rate |
New listing (building reviews) | — | 30 | — |
Seasonal market (summer peak) | 26 | 28 | 92.9% — likely underpriced |
Disciplined pricing, shoulder month | 20 | 26 | 76.9% |
The seasonal example at 92.9% isn’t a trophy. It’s a signal to raise rates next year.
What does “good” occupancy look like in Vancouver?
There’s no single target that fits every property. That said, disciplined pricing typically lands properties in the 65–78% range. Below 55% usually points to a pricing mismatch, a listing-quality problem, or a regulatory constraint on availability. Above 90% consistently points to underpricing.
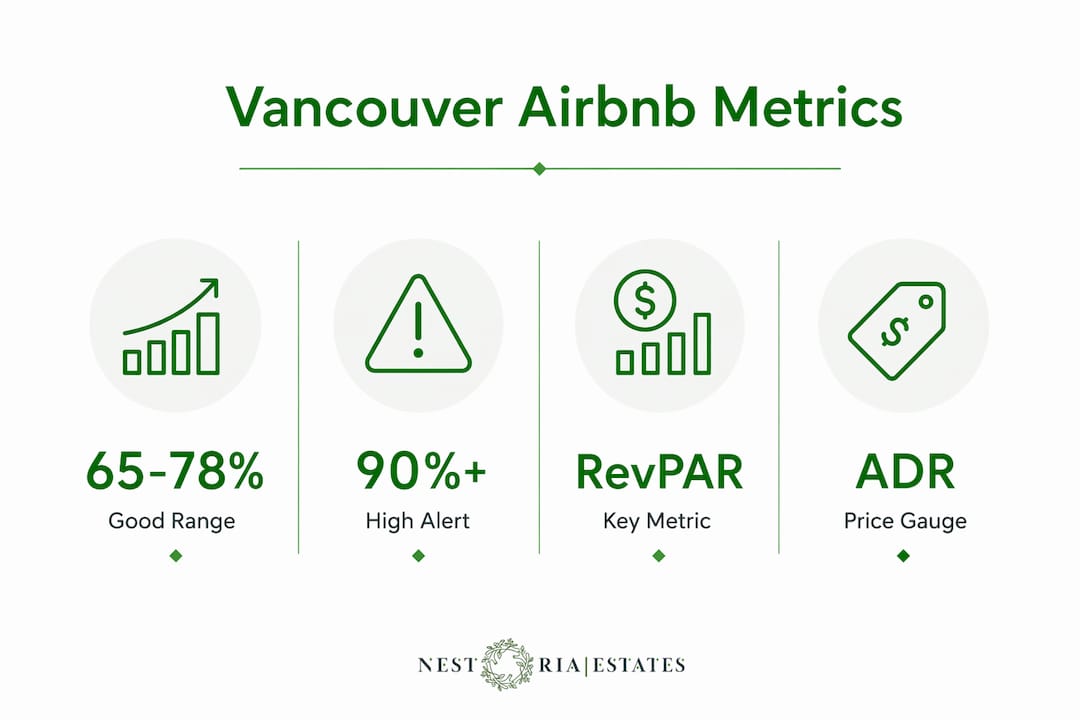
Vancouver adds its own wrinkles. The city’s short-term rental regulations limit which properties can legally operate, which compresses supply and can push compliant-listing occupancy higher than national averages suggest. Event-driven weekends — major conferences, sports events, festivals — spike demand sharply and reward owners who price proactively rather than reactively.
Performance signal | What it likely means | Action |
Occupancy below 55%, ADR at market | Listing visibility or quality problem | Improve photos, title, reviews |
Occupancy 65–78%, RevPAR growing | Disciplined pricing working | Maintain and refine seasonally |
Occupancy above 90%, RevPAR flat | Underpriced | Test rate increases |
Occupancy dropping, ADR holding | Demand softening or competition rising | Check local comps via AirDNA |
What tactics and tools actually move occupancy?
The framework in one line: set price guardrails (floors and ceilings), automate rate moves, and manage stay rules to prevent orphan nights. Everything else is execution.
Core tactical levers:
Dynamic pricing: Static “set-and-forget” pricing is the most common cause of revenue underperformance. Tools like PriceLabs digest local events, competitor pacing, and seasonality to adjust rates automatically. Dynamic pricing users can earn roughly 20–36% more annual revenue than those on manual seasonal pricing after proper configuration.
Minimum-stay rules by lead time: Long minimums during low-demand windows create orphan days that earn nothing. Short minimums during peak protect your rate.
Last-minute discounts: Drop to a 1-night minimum within 7 days to capture late demand that would otherwise go to a competitor.
Weekend/weekday differentials: Urban Vancouver markets often see Tuesday/Wednesday troughs and Friday/Saturday peaks — price them differently.
Channel and calendar hygiene: A synced calendar across all platforms prevents double-bookings and keeps your availability accurate for search ranking.
Event-based pricing: Pre-load rate increases before major Vancouver events, not during them. Early bookers pay a premium; last-minute bookers fill gaps.
For market data, AirDNA gives you local comp occupancy and ADR benchmarks so you’re comparing against your actual neighborhood, not a national average. PriceLabs handles the automated rate logic.
Pro Tip: Test any new pricing configuration for 8–12 weeks before judging results. Booking windows mean changes take time to show up in occupancy data. Adjust one variable at a time so you know what moved the needle.
Which metrics should you track alongside occupancy?
RevPAR is the primary metric because it combines price and fill rate into one number. Track it first. Then add the others once your baseline is stable.
Metric | Definition | What a problem looks like |
ADR | Total revenue ÷ booked nights | Low ADR + low occupancy = pricing or visibility issue |
RevPAR | ADR × occupancy rate | Flat or falling RevPAR despite high occupancy = underpriced |
Length of stay (LOS) | Average nights per booking | Very short LOS with high turnover costs = minimum-stay adjustment needed |
Booking lead time | Days between booking and check-in | Shrinking lead time = guests booking later; open calendar further out |
Cancellation rate | Cancelled bookings ÷ total bookings | Rising rate = policy or listing-expectation mismatch |
Cadence: check pickup and pacing weekly, review RevPAR monthly, and adjust your broader strategy quarterly.
DIY tools vs. hiring a manager: what to expect
Automation plus correct guardrails can show measurable RevPAR lift in 8–12 weeks. Hiring a professional manager reduces execution risk and delivers faster, ongoing optimization — especially for owners who don’t want to monitor pacing data weekly.
DIY 30/60/90-day timeline:
Days 1–30: Pull 12 months of booking data, map your seasonality, set up AirDNA comps, configure PriceLabs with price floors and ceilings.
Days 31–60: Run your first pricing test. Monitor weekly pacing. Adjust minimum-stay rules for the next 8 weeks.
Days 61–90: Review RevPAR vs. the prior period. Refine guardrails. Identify shoulder-season gaps and pre-load promotional rates.
Cost comparison:
PriceLabs subscription: publicly listed pricing varies by portfolio size; check their site for current rates.
Professional manager (revenue-share model): typically charges a percentage of gross rental income and covers dynamic pricing, guest communication, cleaning coordination, maintenance, and owner reporting.
The DIY route costs less in fees but requires consistent weekly attention. A manager’s revenue-share fee often pays for itself through better pricing discipline and fewer missed revenue windows — particularly during Vancouver’s event-driven demand spikes.
Common mistakes that quietly kill your RevPAR
Chasing occupancy without watching ADR and RevPAR is the most expensive mistake Vancouver owners make. Here’s what it looks like in practice and how to fix each one.
Underpricing to fill the calendar. If your occupancy has been above 90% for months, you’re not winning — you’re subsidizing your guests. Test a rate increase. You can afford to lose a few bookings and still come out ahead on RevPAR.
Set-and-forget pricing. A static rate ignores events, competitor moves, and seasonal shifts. The listing quality and pricing factors that drive Airbnb search visibility change constantly. Manual pricing can’t keep up.
Wrong denominator. Including owner-blocked nights in “available nights” deflates your occupancy rate and makes a healthy property look underperforming. Always use nights genuinely open to guests.
Rigid minimum stays. A 3-night minimum in a slow week creates unbookable orphan gaps. Drop to 1–2 nights during low-demand windows to convert those nights into revenue.
Ignoring booking pace. If your next month is 40% booked and the same period last year was 65% booked at this point, that’s a signal to act now — not after the month closes empty.
For a broader look at vacation rental yield mistakes, the patterns repeat across markets.
Key Takeaways
Occupancy rate management works when you optimize for RevPAR — not fill rate — using dynamic pricing, correct benchmarks, and stay-rule discipline.
Point | Details |
Use the right formula | Exclude owner-blocked and maintenance nights from available nights or your occupancy rate is meaningless. |
Target 65–78% occupancy | Consistent 90%+ almost always signals underpricing; benchmark against local Vancouver comps, not national averages. |
RevPAR is the real scorecard | Track ADR × occupancy rate weekly; occupancy alone can hide a pricing problem. |
Automate pricing with guardrails | Set price floors and ceilings in a tool like PriceLabs; test any new configuration for 8–12 weeks before judging. |
Nestoriaestates | Offers free revenue projections and full-service management for Vancouver owners who want data-driven RevPAR optimization without the weekly workload. |
The case for RevPAR-first management in Vancouver
Vancouver’s short-term rental market rewards owners who treat occupancy as a signal, not a goal. The regulatory environment limits supply, which means compliant listings have structural demand advantages — but those advantages evaporate quickly when owners underprice to stay full. The properties that consistently outperform aren’t the ones with the highest occupancy; they’re the ones where pricing, minimum stays, and listing quality are calibrated together and reviewed regularly.
What most owners underestimate is how much the execution gap costs them. Setting up dynamic pricing once and walking away is nearly as bad as static pricing. The real work is in the weekly pacing checks, the event-calendar adjustments, and the quarterly strategy reviews that keep RevPAR moving in the right direction. Nestoriaestates handles exactly that operational layer — continuous pricing adjustments, owner reporting, and guest operations — so the revenue optimization doesn’t depend on the owner having time to monitor it.
Nestoriaestates manages your Vancouver occupancy so you don’t have to
Free revenue projections for Vancouver listings. That’s where Nestoriaestates starts — modeling your property’s RevPAR potential before you commit to anything.

The full-service offering covers everything that moves the needle on occupancy and rate: dynamic pricing calibrated to Vancouver’s event calendar and seasonality, guest communication, cleaning and maintenance coordination, and transparent owner reporting through a dedicated portal. You see exactly what’s happening with your property’s performance without having to manage it yourself.
If you’re a Vancouver owner weighing whether the DIY workload is worth it, see what professional management includes and request a free revenue projection for your listing.
Useful sources and tools
AirDNA — Market-level occupancy and ADR comps by neighborhood; the best starting point for Vancouver benchmarking.
PriceLabs — Automated dynamic pricing with rule-based guardrails; standard tool for STR revenue management.
STRNumbers — Airbnb occupancy benchmarks and interpretation guidance for target ranges.
StaySTRA — 2026 revenue management frameworks including minimum-stay tactics and implementation timelines.
Nestoriaestates — Services — Full-service Vancouver Airbnb management with pricing optimization and owner reporting.
Nestoriaestates — Dynamic Pricing Guide — Vancouver-specific guide to setting up and testing dynamic pricing rules.
FAQ
What is occupancy rate management for Airbnb?
Occupancy rate management is the ongoing process of adjusting pricing, minimum stays, and calendar availability to control how many nights your listing gets booked — with the goal of maximizing RevPAR, not raw fill rate.
How do I calculate my Airbnb occupancy rate?
Divide booked nights by available nights (excluding any nights blocked for personal use or maintenance), then multiply by 100. For example, 20 booked nights out of 26 available equals 76.9%.
What is a good occupancy rate for a Vancouver short-term rental?
A target range of 65–78% is typical for properties with disciplined pricing. Consistent occupancy above 90% usually signals the nightly rate is too low, not that the property is performing well.
What is RevPAR and why does it matter more than occupancy?
RevPAR (Revenue Per Available Room Night) equals ADR multiplied by occupancy rate. It captures both pricing and calendar utilization in one number, making it a more reliable performance benchmark than occupancy alone.
Can Nestoriaestates help improve my Vancouver property’s occupancy rate?
Nestoriaestates provides full-service management including dynamic pricing, guest operations, and owner reporting, along with free revenue projections that model RevPAR improvement for Vancouver listings.
Recommended
Comments